Manual plotting and labelling
Plotting coordinates and adding bearings, distances, and point labels manually takes time and creates opportunities for drafting errors.
Turn survey coordinates into clear, labelled plots with roads, map context, boundary editing, and automated survey-plan layouts.
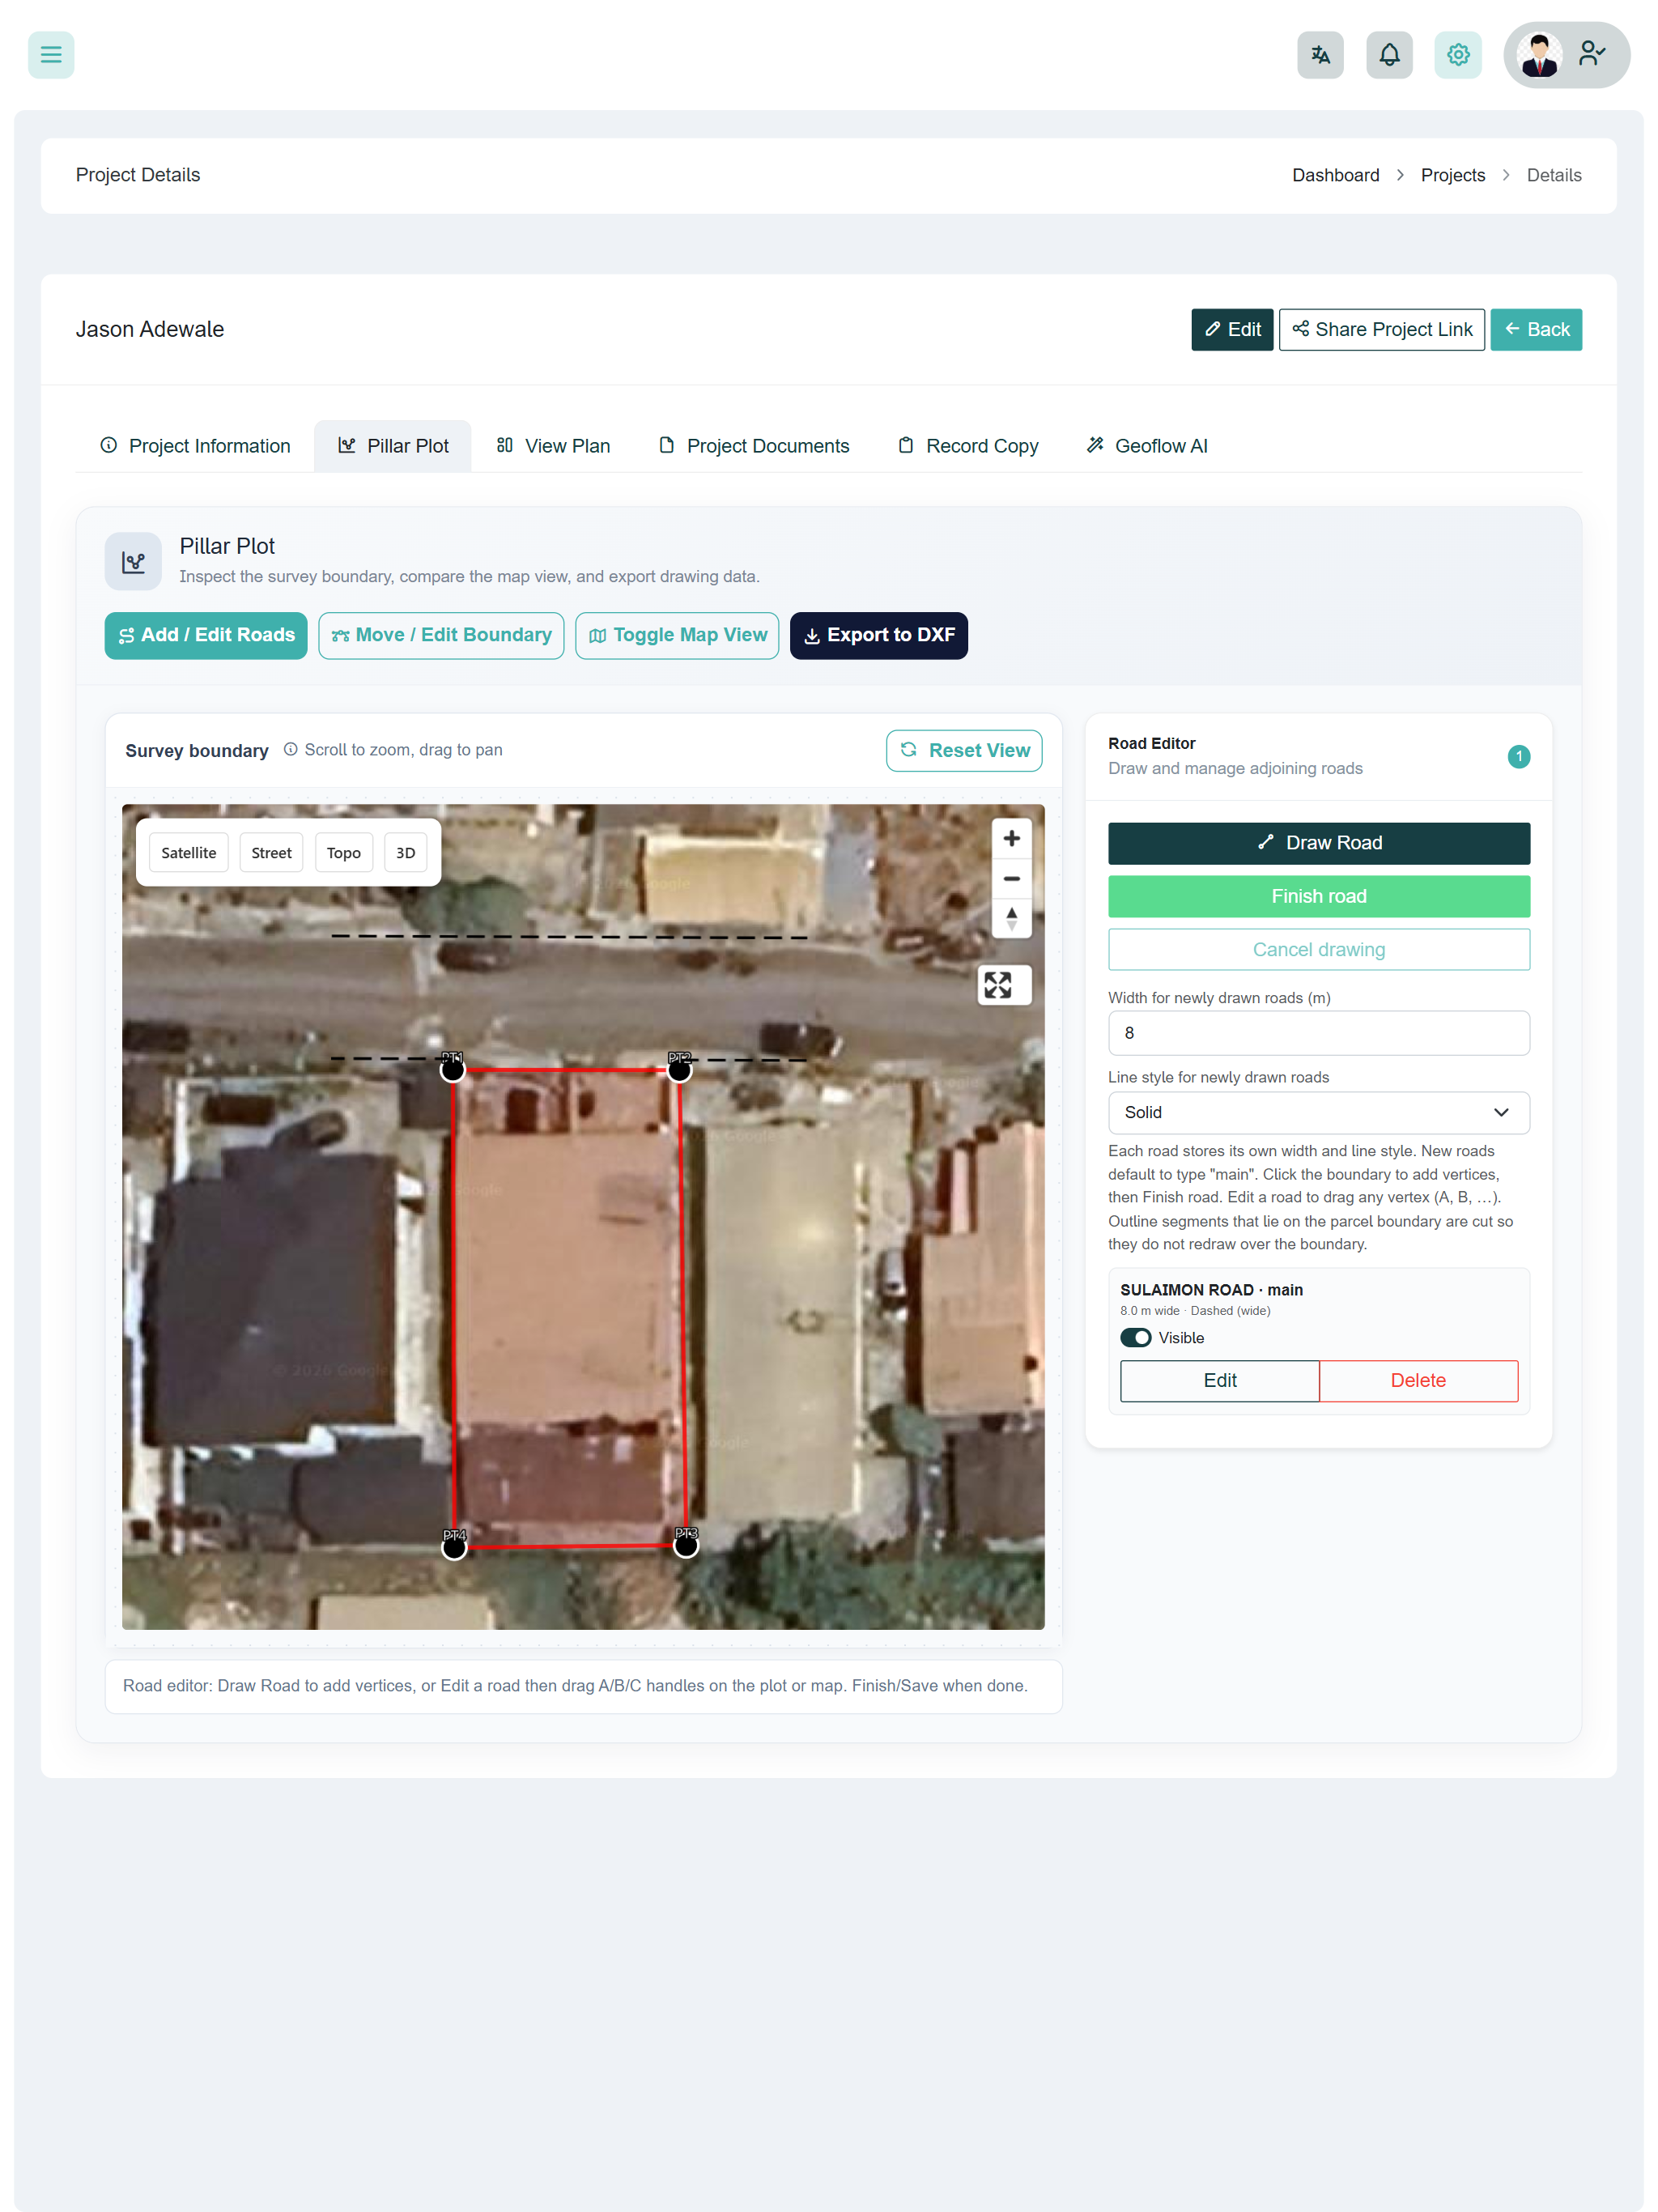
Survey coordinates are only the beginning. After collecting the data, surveyors still have to plot points, calculate and label bearings and distances, add surrounding features, make adjustments, and build the survey plan before the final CAD work begins.
Plotting coordinates and adding bearings, distances, and point labels manually takes time and creates opportunities for drafting errors.
Roads, boundaries, annotations, and surrounding features often have to be recreated from scratch before a presentable plan can be produced.
Even when a firm already has a professional survey-plan format, setting up each new project to match the firm's branding and layout can take unnecessary time.
Bring the pillars and coordinate data for your survey project into Geoflow.
Plot the geometry and generate the bearings, distances, and point labels from the survey data.
Add roads and surrounding map context, or adjust boundary coordinates directly where the survey requires it.
Apply your firm's branded survey-plan template and generate a structured first version ready for final drafting and CAD finishing.
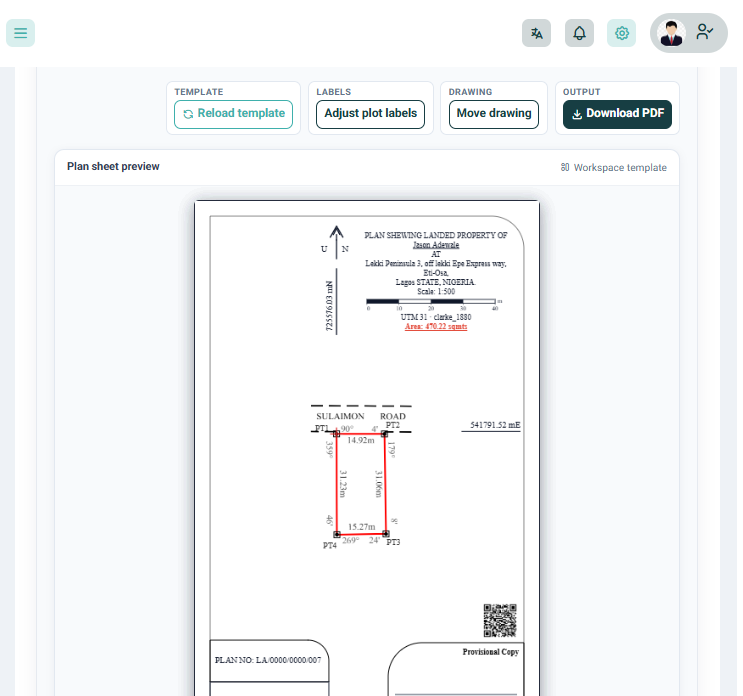
Plot your survey coordinates, automatically label bearings and distances, add roads and map context, adjust boundary coordinates directly on the map, and generate the first version of your survey plan using your firm's branded template.
Go deeper than a feature list — each capability is built for survey operations in Nigeria.
Plot survey coordinates into their correct geometric relationship without manually placing every point.
Generate and label bearings and distances from the plotted geometry so the surveyor does not have to calculate and annotate every leg manually.
Add roads and surrounding geographic context to help create a more complete representation of the survey site.
Adjust boundary coordinates and refine the geometry directly from the map when changes are required.
Apply your firm's survey-plan template and automatically place the project information and plotted geometry into your established layout.
Move from field coordinates to a structured survey plot faster while retaining control over the final survey deliverable.
Standardise plotting and survey-plan preparation across jobs while keeping your firm's own branded templates.
Turn coordinate data into labelled geometry and a structured plan layout before final CAD drafting and review.
“Instead of starting every plot from scratch, we can get the geometry and labels prepared and then focus on the final drafting whilst still having our data secured on teh cloud, a true game changer for us.”
See how Geoflow takes your survey data from coordinates to plotted geometry and a branded plan layout.